This project is supported by NASA Grant NNX08AK28G under
PPS.
One decade of TRMM data enough to show the trend of the climate change?
Observations of the precipitation and the population of the storms during the past decade
would certainly help us understanding the climate change.
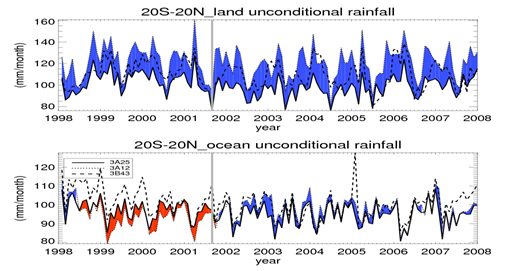
However, we have to be cautious on how to interpret the long term satellite observations.
The calibration of satellite data has always been a challenge, such as instrument sensitivity degradation etc.
For TRMM observations, this becomes more complicated because there was a satellite orbit change from 350 km to 402 km
in August 2001 to extend the life time of the observation. The orbit change leads to different instrument geometries and
sensitivities (DeMoss and Nowman 2007; Shimizu et al. 2009; Short and Nakamura 2010).
Besides the orbit boost, the diurnal sampling is an other issue that has to be taken into account when interpreting
the long term trend in the TRMM observations (Negri et al 2002).
Here we present the monthly variation of the
population and rainfall contribution from Precipitation Features (defined from TRMM PR near surface rainfall)
with different size and intensities. However, these results needs to be interpreted cautiously with the background of
the TRMM satellite boost and instrument sensitivity changes.
.
Time series of population and rainfall contribution of PFs with different sizes and intensities
)
)
)
)
)
)
)
)
)
)
)
)
)
)
)
)
)
)
)
)
)
)
)
)
)
)
)
)
)
)
)
)
)
)
)
)
)
)
)
)