This project is supported by NASA Grant NNX08AK28G under
PPS.
 Vertical Structure of storms
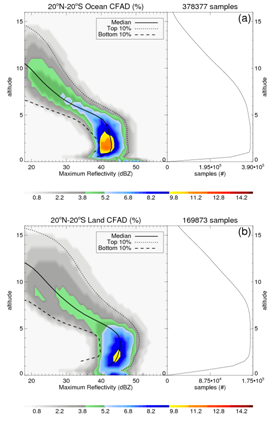
Another application of the TRMM precipitation feature database is to study the regional variations of vertical structures of precipitation features. Focusing on the precipitation systems with strong convection indicated by the presence of at least one 40 dBZ echo and a minimum size of 1000 km^2, the Contoured Frequency by Altitude Diagrams (CFADs, Yuter and Houze 1995) of maximum reflectivity profiles show that there are significant differences between the vertical structures of convection over land and ocean (left figure):
Land convection has larger maximum reflectivity values than oceanic convection at the freezing level (4-5 km). Then the land convection maximum reflectivity values decrease more slowly than oceanic convection above the freezing level, while reaching higher altitudes. Half of the land (ocean) convection has maximum reflectivity values > 20 dBZ at 11.5 km (10 km). From 2 km to the freezing level near 5 km, the maximum reflectivity of land convection increases with altitude, but that of the oceanic RPPFs decreases with altitude.
To investigate seasonal and regional differences in the vertical structure of convective systems, we have selected 9 years of precipitation systems with 40 dBZ and 1000 km^2 in size observed by TRMM. The CFADs of maximum reflectivity profiles of these systems (categorized by size) are analyzed over 10x10 degree boxes in 35S-35N. The details can be accessed through the links below.
CFADs of maximum KuPR reflectivity profiles of GPM precipitation features with 40 dBZ
CFADs of maximum PR reflectivity profiles of TRMM precipitation features with 40 dBZ
Please choose the categories of the precipitation systems from below: