|
|
Mean properties of precipitation system
During 1998-2013, total 716990
snapshots of precipitation features with size > 80 km^2 have been collected over
EE_PACIFIC_ITCZ
, where 9004
of them have lightning flashes inside. Some mean properties of these features are listed below:
| samples (#) | mean size (km^2) | mean volumetric rain (mm/hr*km^2) | mean echo top (km) |
mean 30 dBZ ehco top (km) | mean flash count (#) |
| All | 716990 | 321 | 1220
|
4.4 |
1.4 |
0.10 |
| DJF | 114934 | 205 | 669
|
3.7 |
1.0 |
0.01 |
| MAM | 154553 | 279 | 1111
|
4.7 |
1.6 |
0.10 |
| JJA | 238880 | 384 | 1489
|
4.7 |
1.4 |
0.15 |
| SON | 208623 | 344 | 1296
|
4.3 |
1.3 |
0.08 |
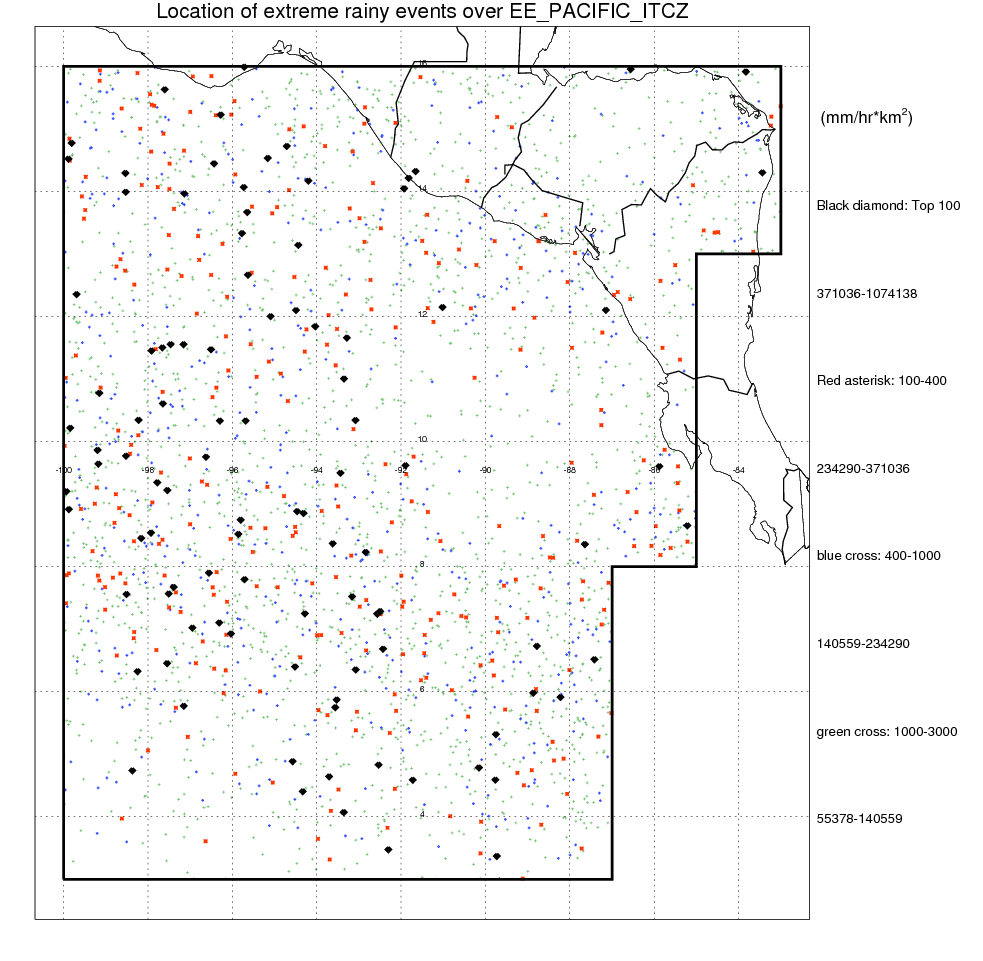
Extreme rainy events
In all 716990 precipitation features, top 1% ( volumetric rain >
19853 mm/hr*km^2) rainy features contribute
63
% of total rainfall. Top 100 rainiest events observed by TRMM during 1998-2013 over
EE_PACIFIC_ITCZ are listed here .
Following figure shows the location of the precipitation feautres categorized by the volumetric rainfall.
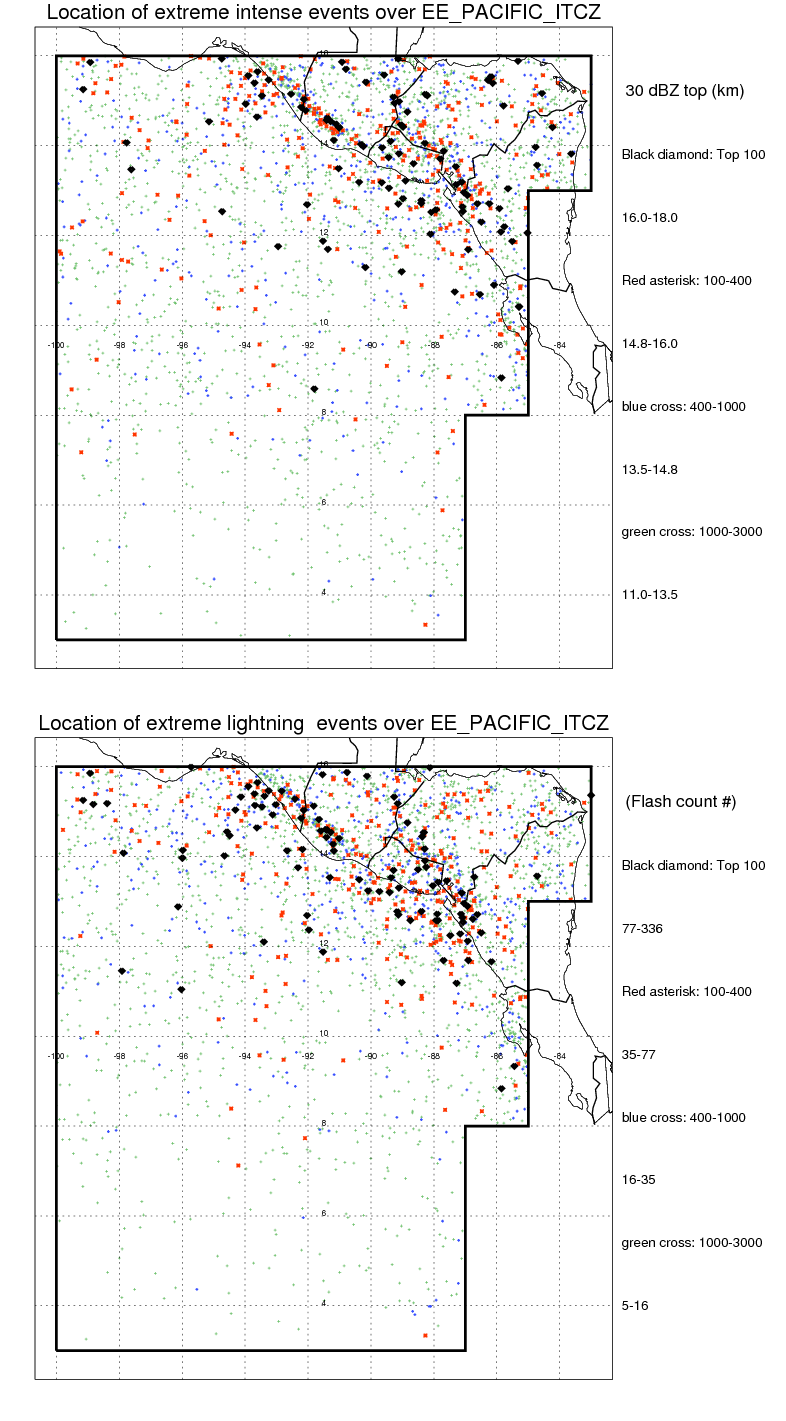
Extreme intense events
Some of the precipitation sytems are much intense with large hails and many lightning than others (see the lists of top
lightning storms.
Following figure shows the location of the precipitation feautres categorized by the lightning rate and 30 dBZ echo top.
|